AI automation  •  Microsoft Fabric  •  Power BI  •  Copilot
Customer & growth analytics

Unify marketing, sales and customer signals into one decision layer.

Integrate Google Ads, Meta Ads, TikTok, LinkedIn, GA4/web, Salesforce CRM, email, WhatsApp and business data in Microsoft Fabric to understand the full customer journey.

Illustrative solution pattern. The scope and measures are adapted to your sources and business definitions.

Multiple sources→Microsoft Fabric→Semantic model→Power BI + Copilot
Business measures

Measure the outcomes that matter.

These are example KPI categories—not performance claims—and are tailored to each client’s definitions.

CPLCost per lead
CPQLCost per qualified lead
Journey VelocityTime from lead to revenue
MERTotal revenue ÷ total marketing spend — overall marketing efficiency
Blended ROASTotal revenue relative to advertising spend — portfolio-level efficiency
Platform ROASRevenue attributed by Meta / Google ÷ spend — channel optimization; not absolute truth
CACCost to acquire a new customer — acquisition economics
nCACSpend ÷ genuinely new customers — better for growth decisions
LTV:CACCustomer lifetime value relative to CAC — long-term unit economics
Contribution MarginRevenue less variable costs — whether growth is actually profitable
Marginal ROASIncremental revenue from the next dollar of spend — determines whether to scale further
Incremental ROAS / iROASRevenue genuinely caused by advertising ÷ spend — causal measurement
MMMStatistical estimate of channel contribution — strategic budget allocation
Incrementality TestingMeasures what would happen without advertising — validates true media impact
Payback PeriodTime required to recover CAC — cash efficiency
Questions this helps answer

Turn fragmented data into decision-ready context.

Which channels drive qualified leads?

Where do leads stall?

Which campaigns influence conversion?

Where are duplicate or overlapping journeys?

Which segments need reactivation?

How effective are email and WhatsApp journeys?

Simplify the journey

From disconnected data to one governed model.

Unify the data once, model business meaning once, and reuse it across dashboards, analytics and AI.

Advertising / digitalCRMWeb / appsEmail / messaging
→
OneLakeMedallionSemantic Model
→
Power BICopilotDecisions
Key capabilities

What the solution can include.

01

Customer journey mapping

Visualize the path from acquisition to conversion.

02

Lead lifecycle analytics

Track leads from first touch to closed won.

03

Campaign effectiveness

Connect spend, lead quality and revenue outcomes.

04

Attribution & contribution

Analyze multi-touch influence across channels.

05

Audience segmentation

Build reusable high-value customer segments.

06

Executive dashboards

Give leadership a governed performance view.

Separate attribution from causation.

Channel-attributed revenue is not the same as incremental impact. Agree definitions and measurement limitations; causal methods require appropriate data and evaluation design.

AI-powered analytics

Copilot for marketing and customer questions.

Explore campaign performance, lead quality, journey bottlenecks and conversion drivers using governed business definitions.

  • Ask which campaigns generated the most qualified leads
  • Investigate stage drop-off and journey velocity
  • Compare source contribution to conversion and revenue
  • Use the same semantic model across dashboards and conversational analytics
Reference architecture

See how the data comes together.

SteadfastGlobal Unify Data. Engineer Intelligence. Drive Action. STEADFAST GLOBAL · REFERENCE ARCHITECTURE

Microsoft Fabric End-to-End Architecture

From source systems and ingestion to OneLake, semantic models, Power BI and business outcomes.
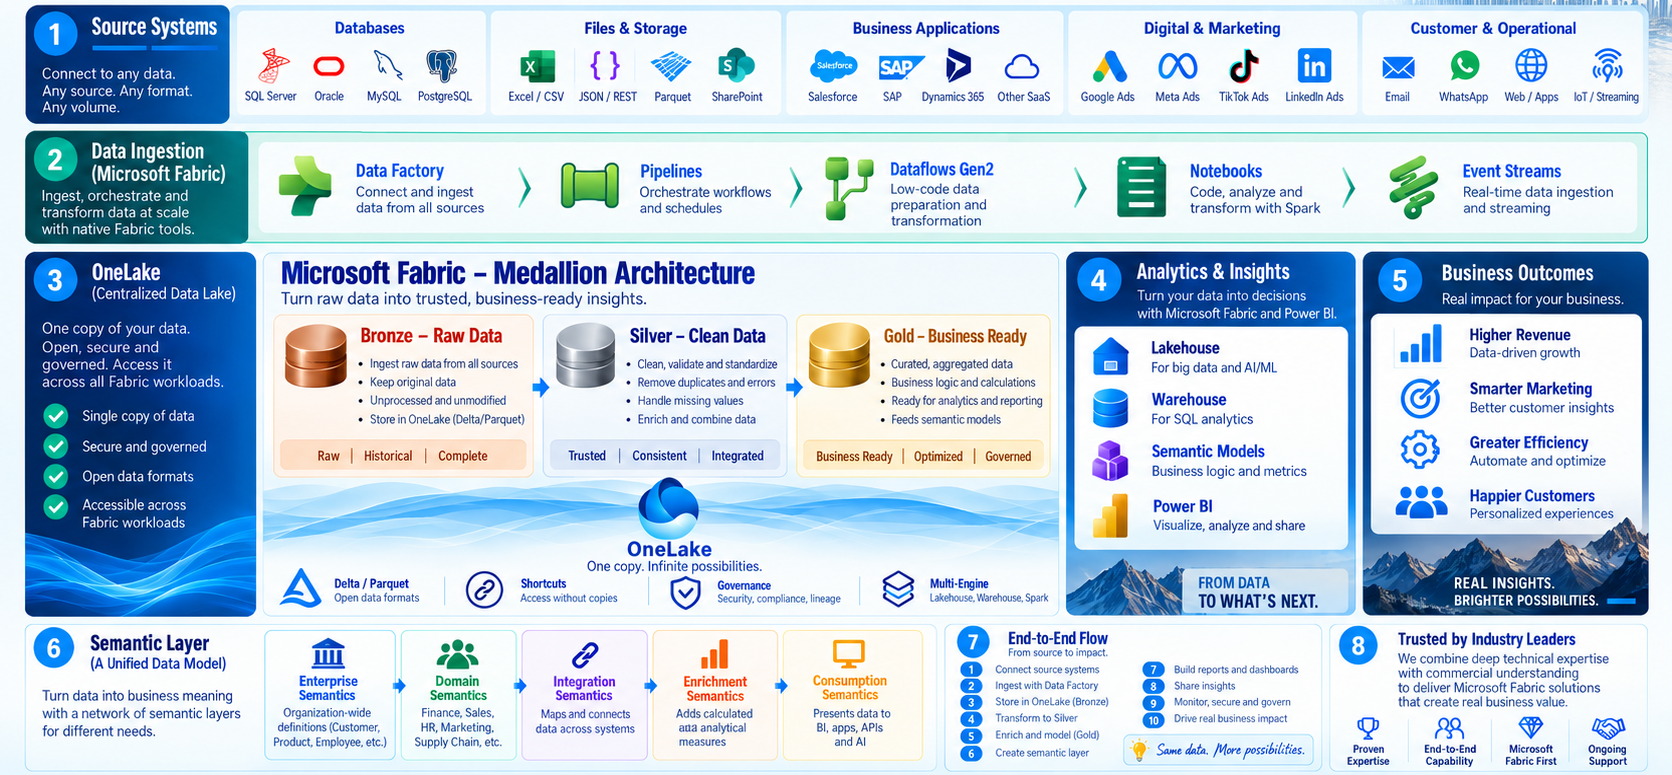
Illustrative Fabric architecture linking source systems, ingestion, OneLake data layers, semantic models and reporting.Illustrative patternAdapt to your sources, controls and operating model.
Unify marketing, sales and customer signals into one decision layer.Original Steadfast Global reference visual.Inspect the full diagram →Illustrative architecture. Outcome labels describe possible aims, not verified client results or guarantees.
FAQ

Questions about this solution.

What data sources can this solution combine?
The architecture can combine relevant CRM, ERP, marketing, web, application, file, API and SaaS sources. The exact integration method depends on source capability and latency requirements.
Can Copilot be used with this solution?
Yes, where licensing and tenant configuration support it. We focus first on governed semantic models and permissions so natural-language analytics has reliable business context.
Can this solution be phased?
Yes. We normally start with the highest-value decisions and data sources, then expand the model and consumption experiences in controlled increments.