See the complete path from pipeline to revenue.
Bring CRM, order, pricing, billing and customer data together to create consistent pipeline, conversion, forecast and revenue intelligence.
Illustrative solution pattern. The scope and measures are adapted to your sources and business definitions.
Measure the outcomes that matter.
These are example KPI categories—not performance claims—and are tailored to each client’s definitions.
Turn fragmented data into decision-ready context.
Where is pipeline growing or shrinking?
Which stages create the most delay?
Which teams or segments convert best?
How accurate is the forecast?
What is driving revenue variance?
From disconnected data to one governed model.
Unify the data once, model business meaning once, and reuse it across dashboards, analytics and AI.
What the solution can include.
Pipeline analytics
Track opportunity movement and stage aging.
Conversion analysis
Measure win rates by segment, team and source.
Forecast intelligence
Compare forecast, pipeline and actual performance.
Revenue bridge
Explain movements across products, customers and periods.
Agree how a sale becomes revenue.
Opportunity stages, booking dates, billing and recognized revenue can describe different events. Keep those distinctions visible when linking pipeline and financial results.
See how the data comes together.
Microsoft Fabric End-to-End Architecture
From source systems and ingestion to OneLake, semantic models, Power BI and business outcomes.
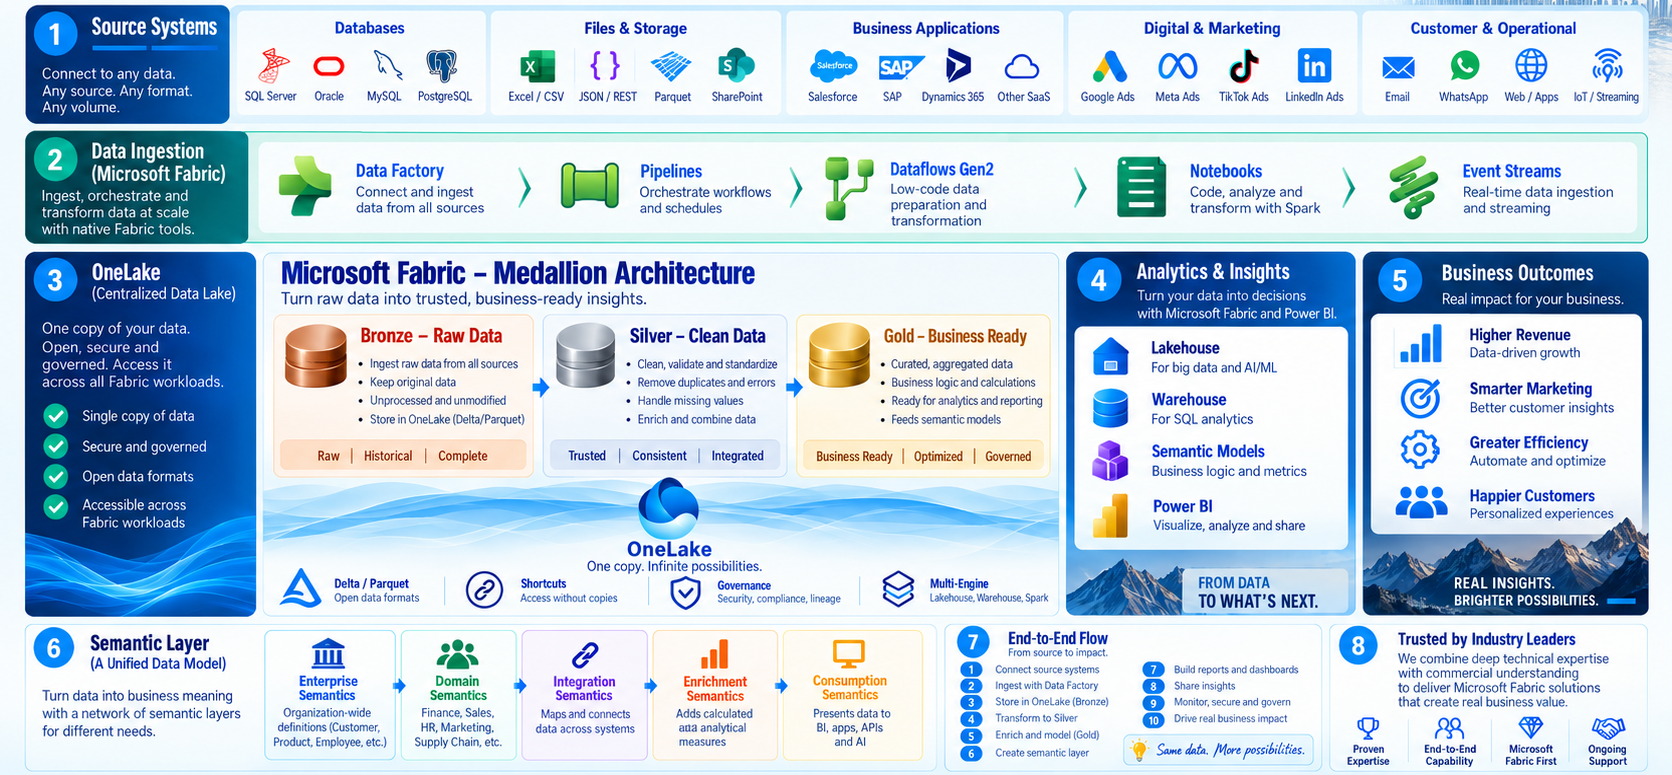 Illustrative patternAdapt to your sources, controls and operating model.